
Screening Poultry Project Markets by Country: What Production Data Shows — and How to Qualify Real Buyers

Country production data tells you where poultry is produced at scale — not who is buying. Use it to shortlist markets, then qualify each project owner by scope, capacity, site, rules and budget.
By HatchMatch Group Sourcing Desk · Last updated 2026-10-14
In short
Short answer: countries are not customers. USDA data shows where chicken meat is produced at scale — in market year 2025 the United States, China, Brazil and the European Union together accounted for about 61% of the world total — but that is a sector-size signal, not proof that any farm or company there wants to buy equipment. Use country data to shortlist where to look, then qualify each buyer: integrated producers, farm groups, hatcheries, processors and procurement teams, one project at a time.
Key takeaways
- Market signal: an official, dated statistic about a country's poultry sector, such as production volume.
- Figures below are USDA Foreign Agricultural Service PSD data for chicken-meat production, market year 2025 (shown on the USDA page as 2025/2026), in thousand metric tons, accessed 14 Oct 2026.
- Production data proves sector scale in a given year.
- Start with the free tools at your own pace.
- Official sources used for the figures above.
Short answer: countries are not customers. USDA data shows where chicken meat is produced at scale — in market year 2025 the United States, China, Brazil and the European Union together accounted for about 61% of the world total — but that is a sector-size signal, not proof that any farm or company there wants to buy equipment. Use country data to shortlist where to look, then qualify each buyer: integrated producers, farm groups, hatcheries, processors and procurement teams, one project at a time.
Key takeaways - Production share measures output, not purchasing intent or budget. - Verified evidence (official statistics, government reports) is separate from a market hypothesis. - Qualification happens at project level: scope, capacity, site, rules, budget and timing. - No country figure says anything about yield, survival or disease outcomes on a given farm. - HatchMatch calculators, guides and the RFQ builder are free for buyers — no subscription, no obligation.
Definitions
Market signal: an official, dated statistic about a country's poultry sector, such as production volume. Market hypothesis: a reasoned guess that projects may exist there, still to be tested. Qualified buyer: an identified organisation with a defined project, decision-maker, site, budget range and timeline.
Country comparison: production signal, not demand
Want these figures for your own site, capacity and country? A HatchMatch specialist builds the budget with you — no buyer fees.
Start freeFigures below are USDA Foreign Agricultural Service PSD data for chicken-meat production, market year 2025 (shown on the USDA page as 2025/2026), in thousand metric tons, accessed 14 Oct 2026. Shares are of the USDA world total of 108,371 thousand tons.
| Market | Production MY2025 (1,000 t) | Share | Evidence and date | Buyer types to qualify | What it does not prove |
|---|---|---|---|---|---|
| United States | 21,773 | 20.1% | USDA PSD, accessed 14 Oct 2026 | Integrators, contract growers, processors | Any open project or budget |
| China | 16,500 | 15.2% | USDA PSD, accessed 14 Oct 2026 | Integrated groups, large farms | Openness to foreign suppliers |
| Brazil | 15,450 | 14.3% | USDA PSD; USDA GAIN Brazil annual (Sep 2026) forecasts 16.3 million t in 2027 and largest exporter | Export-oriented integrators, cooperatives, processors | That a given company is expanding |
| European Union | 12,326 | 11.4% | USDA PSD, accessed 14 Oct 2026 | Farm groups, renovation projects, processors | Uniform rules — member states differ |
| Mexico | 4,153 | 3.8% | USDA PSD; 2026 forecast 4,285 | Integrators, regional farm groups | Financing or import conditions |
| India | — | — | No current value in the PSD download used | Hypothesis only until country-specific evidence is found | Anything — evidence gap |
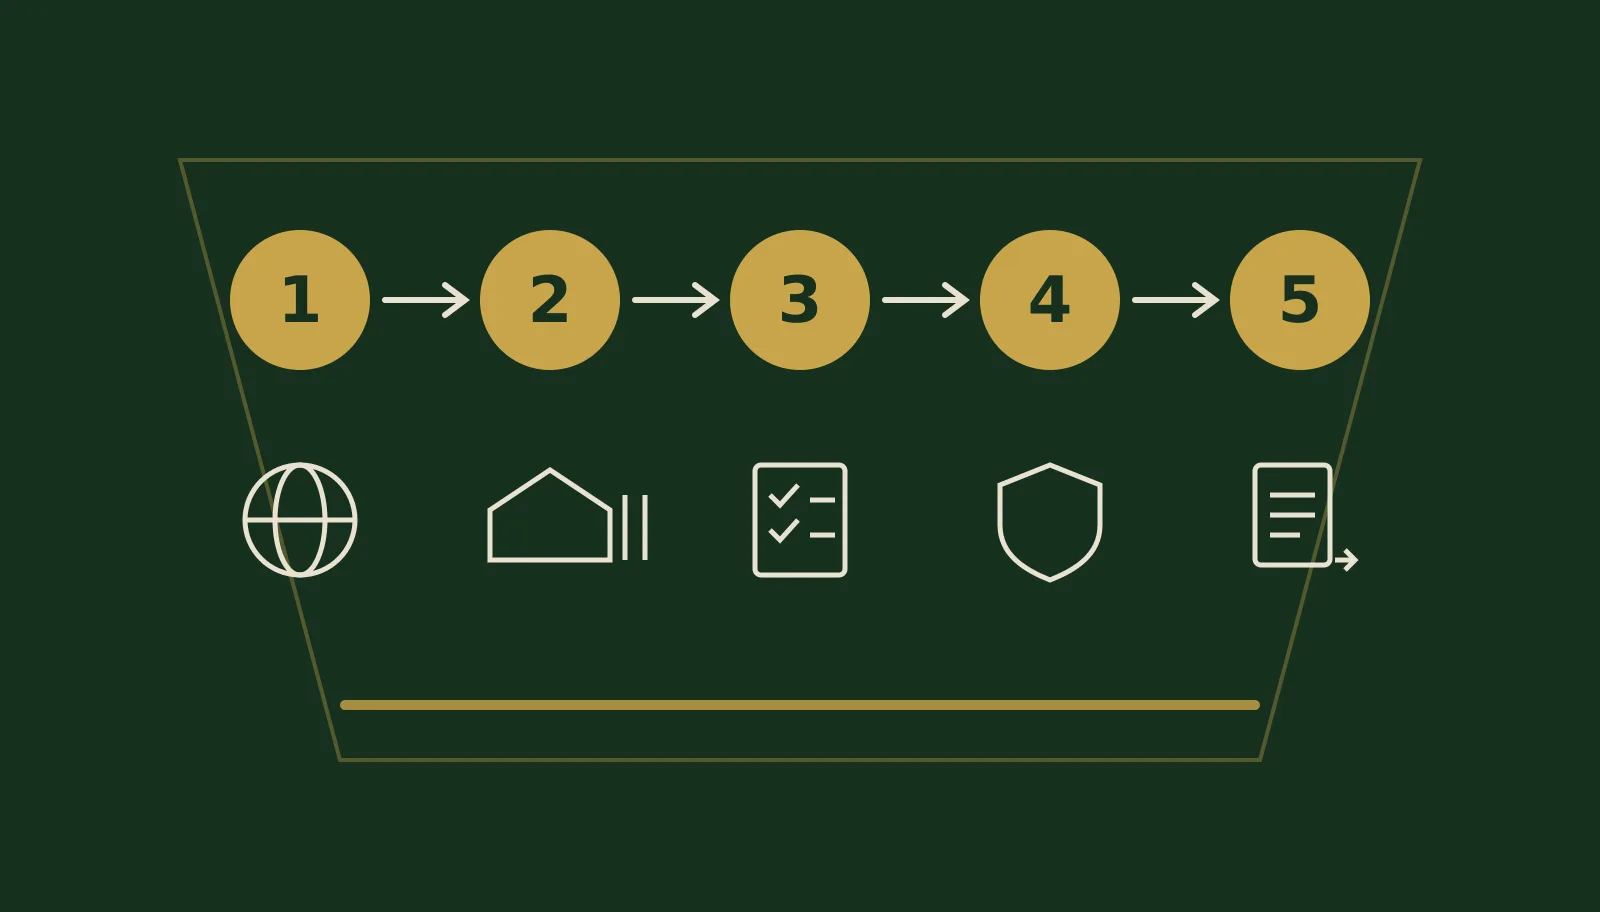
Step-by-step buyer qualification
1. Shortlist markets with dated evidence
Record the source, date and measure for every figure. Production is not imports, and neither equals equipment demand.
2. Identify the project owner
Integrated producer, farm group, hatchery, processor or procurement team — and who decides.
3. Define scope and capacity
Broiler, layer, hatchery or processing; birds or eggs per cycle; new build or upgrade. The broiler vs layer scope guide and the free broiler house layout calculator help frame it.
4. Check site, rules and biosecurity
Housing and ventilation for the climate, energy and backup, feed and water, automation level, local veterinary, welfare, environmental and building requirements — confirmed with qualified local advisers. USDA APHIS biosecurity basics are a useful starting checklist.
5. Test budget and service coverage
Estimate CAPEX and payback in the farm cost calculator, the single place on this site for those estimates, and confirm that installation and after-sales service can reach the site. For Brazil-specific cost context see the Brazil poultry farm cost guide.
6. Turn it into a comparable RFQ
One scope, measurable acceptance tests and the same response format for every supplier — see the KPI planning guide.
Qualification checklist
Use it before any supplier outreach.
- Named organisation and decision-maker - Project type and capacity defined - Site, climate, power and water data available - Local permits, veterinary and welfare checks identified - Budget range and financing status stated by the buyer - Timeline and service expectations written down
What the evidence does and does not prove
Production data proves sector scale in a given year. It does not prove purchase intent, import openness, financing, a supplier's ability to serve the site, or any farm-level performance. A market stays a hypothesis until a real project owner confirms a need. If you want to know where equipment is made rather than where it is used, read where to source poultry equipment.
Next step
Start with the free tools at your own pace. If useful, HatchMatch's human, supplier-neutral team can review your scope and approach suitable manufacturers so you can compare fit and proposals; assisted sourcing is for projects of USD 250,000 or more, and supplier interest is never guaranteed. You decide whether and whom to select. Build your brief in the [RFQ builder](/rfq-builder).
Sources
Official sources used for the figures above.
- USDA FAS — Chicken meat production by country - USDA FAS — PSD Online database - USDA FAS GAIN — Brazil Poultry and Products Annual, Sep 2026 (PDF) - USDA APHIS — Biosecurity basics Written by the HatchMatch Sourcing Desk, data accessed and reviewed 14 Oct 2026. General market information, not investment, veterinary or legal advice; independent technical and translation review pending.
Frequently asked questions
Which countries produce the most chicken meat? In USDA data for market year 2025: the United States, China, Brazil and the European Union, followed by Russia and Mexico.
Does high production mean high equipment demand? Not by itself. It shows sector scale; demand must be confirmed project by project.
Who is the real buyer in a poultry project? An identified integrator, farm group, hatchery, processor or procurement team with a defined project and decision-maker.
Why is India marked as a hypothesis? The USDA PSD download used here has no current India value, so the guide makes no claim without country-specific evidence.
Can country data predict yield or disease risk on a farm? No. Farm outcomes depend on genetics, feed, health, management and local conditions.
Are HatchMatch tools free? Yes. Calculators, guides and the RFQ builder are free for buyers, with no subscription or obligation.
Frequently asked questions
- Which countries produce the most chicken meat?
- In USDA data for market year 2025: the United States, China, Brazil and the European Union, followed by Russia and Mexico.
- Does high production mean high equipment demand?
- Not by itself. It shows sector scale; demand must be confirmed project by project.
- Who is the real buyer in a poultry project?
- An identified integrator, farm group, hatchery, processor or procurement team with a defined project and decision-maker.
- Why is India marked as a hypothesis?
- The USDA PSD download used here has no current India value, so the guide makes no claim without country-specific evidence.
- Can country data predict yield or disease risk on a farm?
- No. Farm outcomes depend on genetics, feed, health, management and local conditions.
- Are HatchMatch tools free?
- Yes. Calculators, guides and the RFQ builder are free for buyers, with no subscription or obligation.
More buyer questions are answered in our poultry procurement FAQ — also available in Español, Français, Português, Deutsch, العربية, Русский, Türkçe, Tiếng Việt.
From this article to a procurement-ready RFQ
HatchMatch Group is an independent sourcing desk — not a manufacturer or EPC contractor. These are the four steps we actually use with commercial poultry and hatchery buyers. If you are still deciding scope, start with what commercial poultry equipment includes and how suppliers are compared.
- 1. Plan the projectCapacity, climate and house layout in one guided workflowOpen
- 2. Build the RFQScope, specifications and comparable line itemsOpen
- 3. Submit the requestReviewed manually before HatchMatch contacts any supplier on the buyer's behalfOpen
- 4. Track and compareFollow status and normalise supplier responsesOpen
Prefer the numbers first? Start with the poultry project cost calculator or browse the project planning guides.